On March 8 and 9, 2017, the University of Rijeka — in collaboration with Montclair State University and the University of Luxembourg — was hosting a digital methods workshop for scholars and students to discuss post-authoritarian and post-conflict accountability issues against the backdrop of innovative digital methods to study questions of individual and collective dealing with the past.
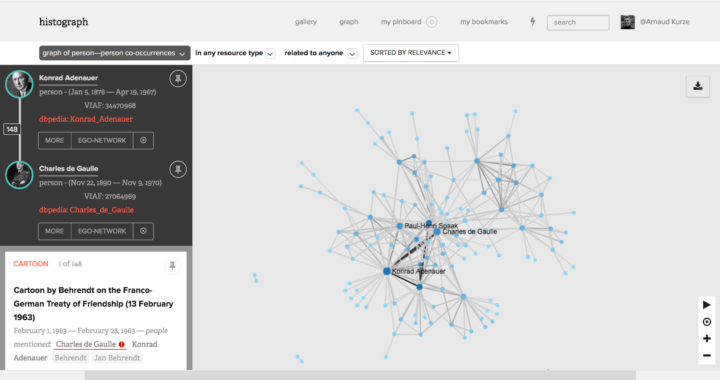
On the first day of the workshop participants focused on the link between geo-mapping and text analysis, based on open-source software called SVEN. Daniele Guido, Lead Designer at the University of Luxembourg, discussed his project histograph, highlighting the challenges associated with facial recognition and network analysis software to retrace the different relationships among political actors during the European integration process since 1945. Participants were then invited to test the different digital methods on their own post-conflict related case studies.
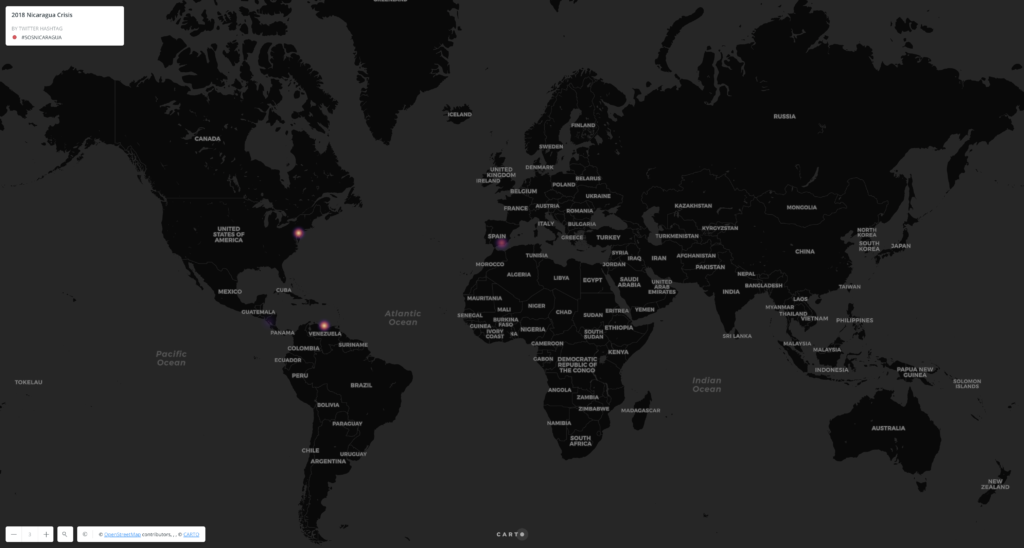
On day 2 of the conference, a renowned Croatian computational linguist, Nikola Ljubešić, affiliated to the Jožef Stefan Institute in Ljubljana, Slovenia, discussed the technical and conceptual challenges of collecting and analyzing large amounts of social media data, such as twitter feeds. The workshop concluded with a roundtable discussion on lessons learned and ideas on how to move forward.
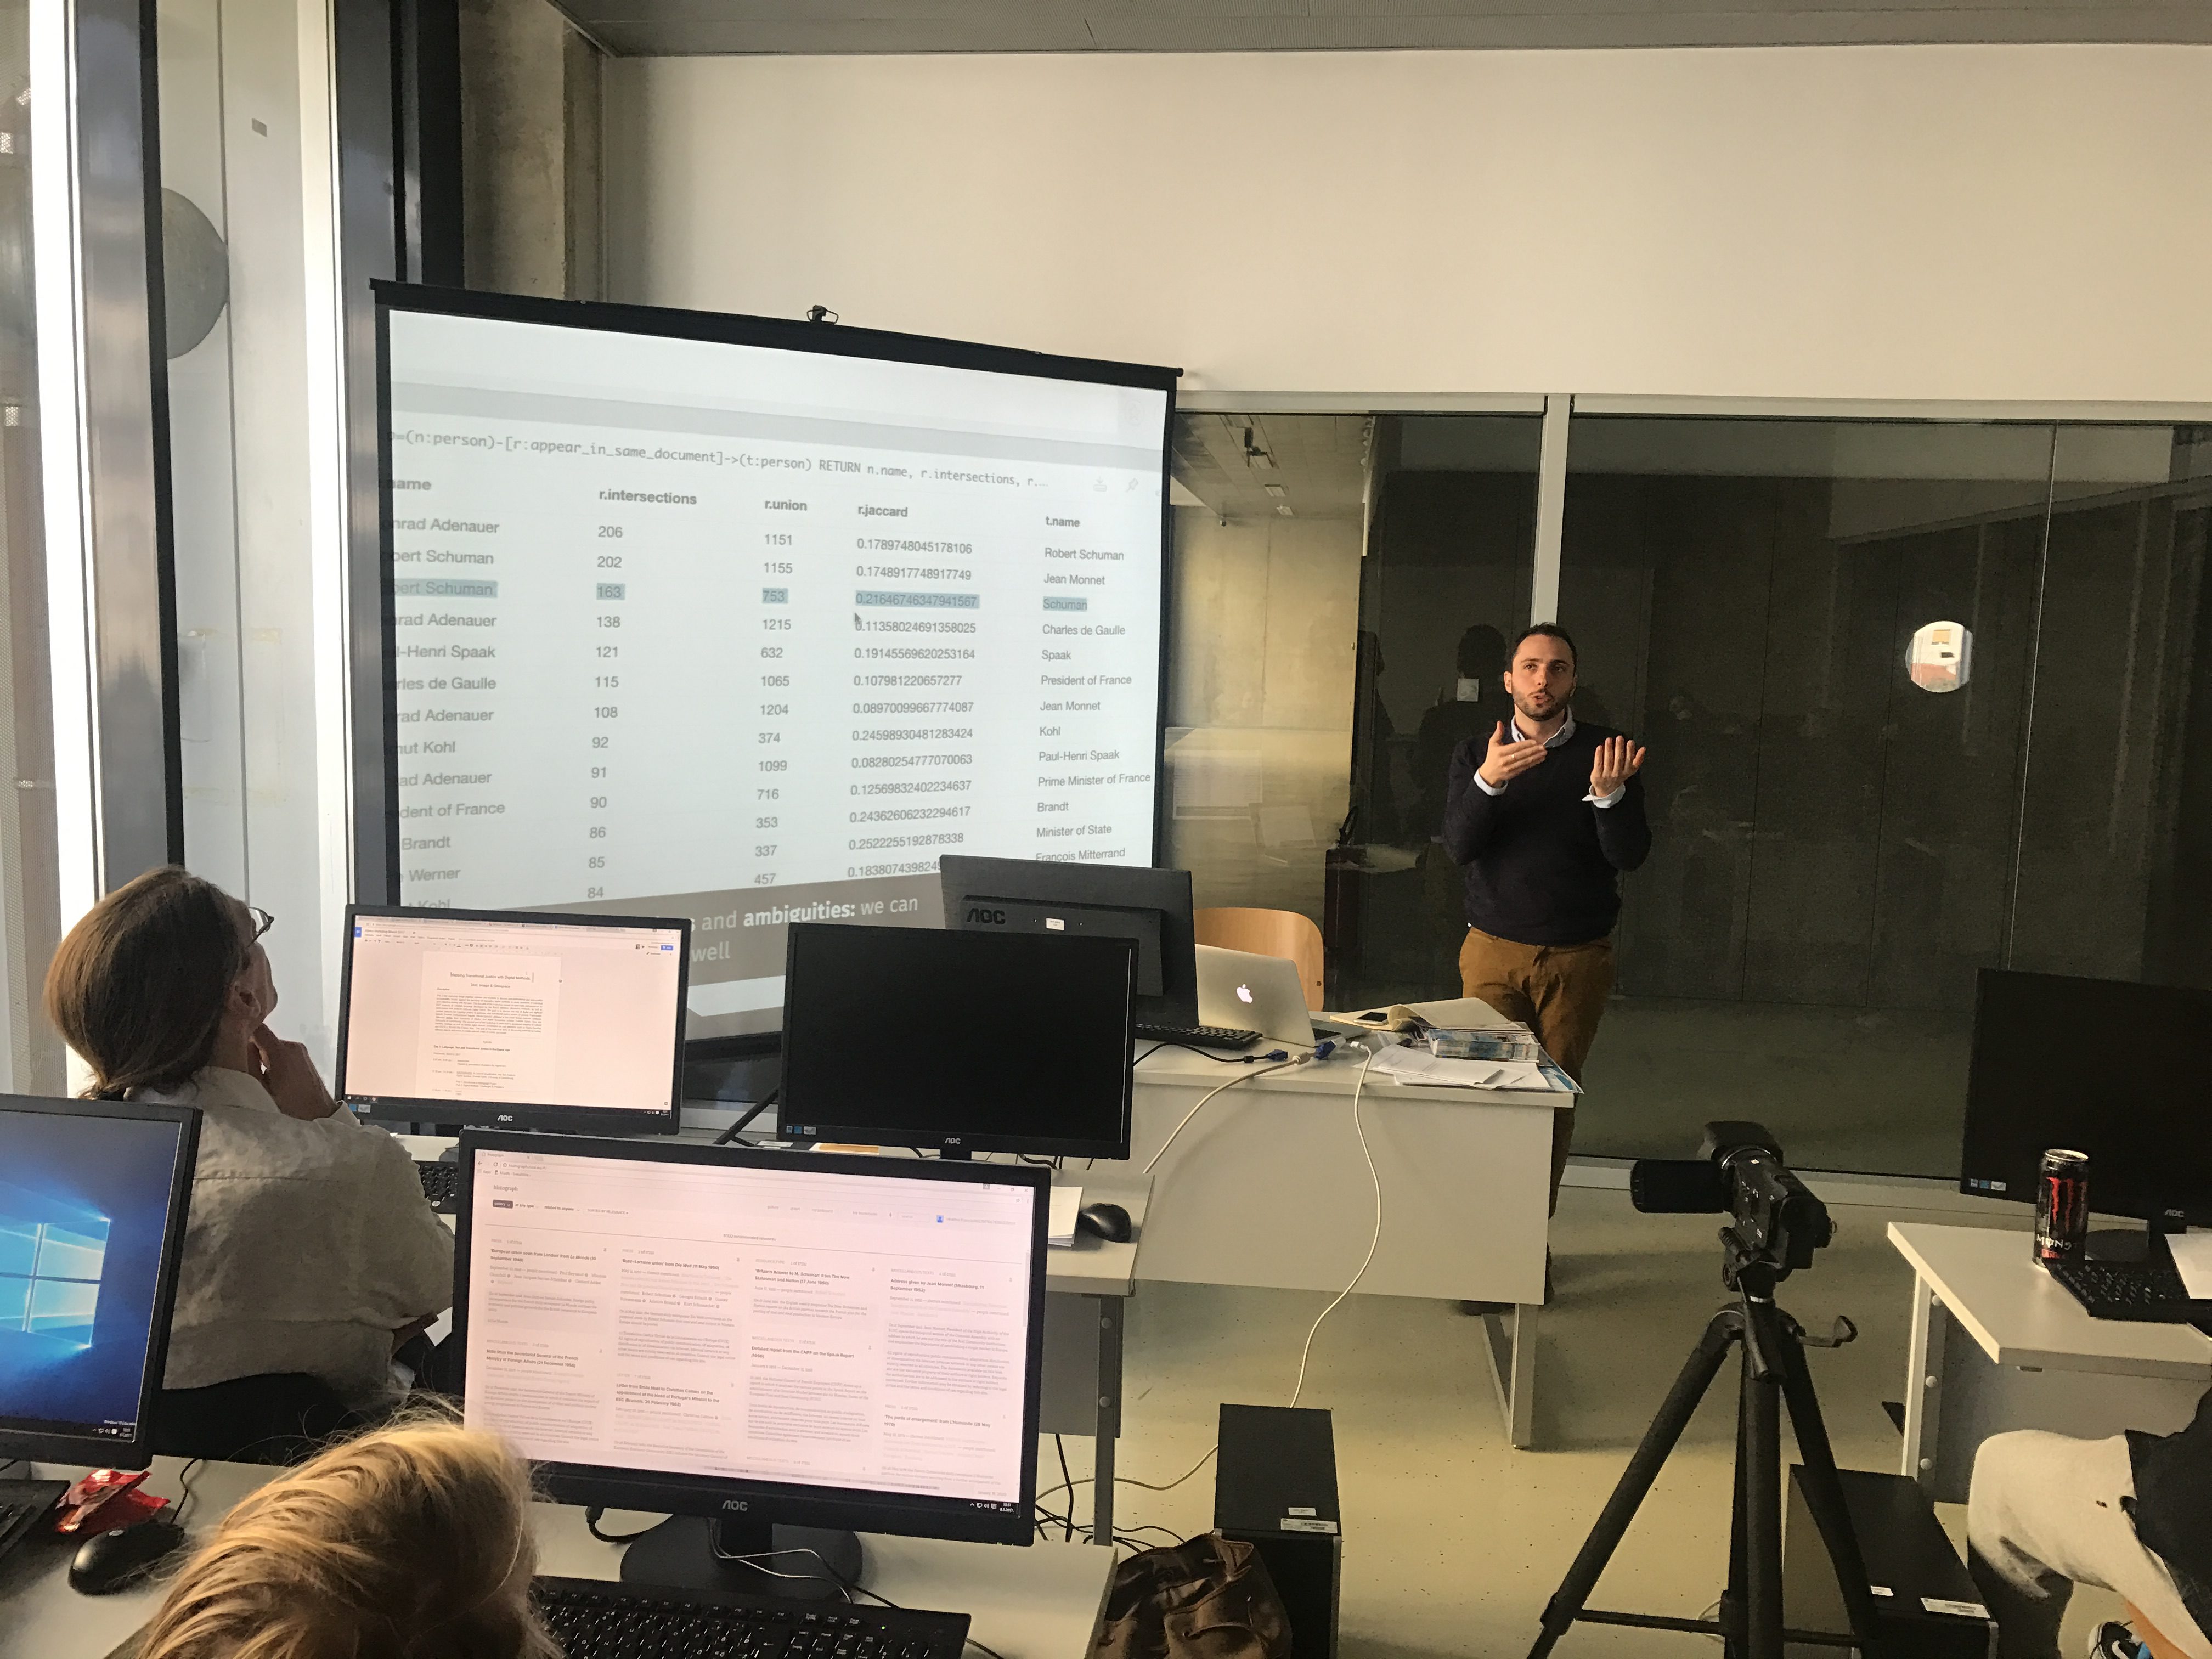
Lead Designer, Daniele Guido, from the University of Luxembourg discussing a data visualization project “histograph”